It is very important to understand the resources available in our linux systems to keep it running smoothly an effortlessly.
top command:
Linux Top command is a performance monitoring program that is used frequently by many system administrators to monitor Linux performance and it is available under many Linux/Unix-like operating systems. The top command is used to display all the running and active real-time processes in an ordered list and updates it regularly. It displays CPU usage, Memory usage, Swap Memory, Cache Size, Buffer Size, Process PID, User, Commands, and much more.
It also shows high memory and cpu utilization of running processes. The top command is much useful for system administrators to monitor and take corrective action when required. Let’s see the top command in action.
#top
iotop command:
iotop or Input/Output top is a command in Linux which is used to display and monitor the disk IO usage details and even gets a table of existing IO utilization by the process.
Let’s see the iotop command in action
You should get a list of running processes along with information about their current disk I/O usage:
It is recommend start using iotop with -o or –only option to see current processes or threads actually doing I/O, instead of watching all processes or threads.
#iotop -o
nload commmand:
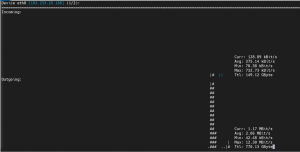
nload is a Linux command-line tool used to monitor network traffic and bandwidth usage in real time, using insightful graphs and traffic statistics.
Can switch between the devices (which you can specify either on the command-line or which were auto-detected) by pressing the left and right arrow keys:
# nload
Or
# nload eth0
nload shortcut keys:
Use left and right arrow keys or Enter/Tab key to switch the display to the next network device or when started with the -m flag, to the next page of devices.
⦁ Use F2 to show the option window.
⦁ Use F5 to save current settings to the user’s config file
⦁ Use F6 to reload settings from the config files.
⦁ Use q or Ctrl+C to quit nload.


